HFT Engine Latency - Part 2
Wake Up, Sleepy CPU

Introduction
In the previous article we explored how to think about latency inside a financial trading engine and walked through practical techniques for measuring real-world performance, using the C++ engine Apex as our test-bed.
In this follow-up we continue our latency investigation and focus on initial improvements. We’ll start by revisiting some observations raised earlier and examine which components in the system might be responsible for performance bottlenecks. From there, we’ll walk through a series of tuning steps, measure their impact, and highlight the Linux tools and commands used along the way.
Where has the time gone?
In earlier measurements the internal software latency along the tick-to-model path came out to roughly 50 microseconds. That’s reasonable startling baseline, but still not where a serious trading engine needs to be.
Within that tick to model journey, a particularly poor stage was S1, taking around 18 microseconds. S1 is simply the time between the system signalling that data is available on the socket and actually reading that data. So not much is really happening, essentially just a socket read - but yet it takes a surprisingly large amount of time.
One general approach to latency optimisation is to look for areas of unexpected poor performance and focus on them for investigation and improvement. This poor socket performance is one such an example - why is this simple section of code taking up so much time?
Looking at the code, we can see it performs very little work. However something hidden or “under the hood” is also happening here, and that is thread scheduling. Under normal operation, market data is typically not available, and so the IO thread will block inside the poll call until data is ready. When data later arrives, the thread must be resumed before it can timestamp the event and perform the socket read.
It is this thread suspend and resume that likely causes the unexpected latency.
When a thread is suspended, it will result in the loss of CPU-resident state: instruction and data cache lines may be evicted, branch prediction state will degrade, and other architectural context may expire. Upon resumption, these structures must be repopulated, often from main memory, introducing delay. However, these sorts of delays are typically in the order of hundreds of nanoseconds, or at most a few microseconds. While such costs are relevant for HFT workloads and must be addressed, they do not explain the observed delay in S1.
So some other hidden activity is happening, causing a delay, and that is where C-states enter the picture.
C-States
Modern CPUs are designed to balance performance with power efficiency. When a core has no work to execute, it can enter a low-power idle mode. These power-saving CPU modes are called C-states.
There are several levels of C-state. The lowest, C0, is when the CPU is active and executing instructions. Beyond that are C1 and deeper states (C2, C3, and so on), each providing progressively greater power savings. As the CPU enters deeper C-states, more of its internal sub-components are temporarily shut down, reducing power consumption. The trade-off is that waking the core back up to C0 takes longer, because more hardware structures must be re-enabled when work arrives.
A helpful analogy is to think of a person employed to perform a sequence of tasks that come their way. C-states correspond to levels of alertness of the worker. C0 is being fully awake and focused - either working or ready to react instantly when a task arrives. C1 is lightly dozing - still easy to wake with minimal delay. Deeper C-states resemble deeper stages of sleep: eyes closed, lights off, fully in bed, snoring into REM sleep. The deeper the sleep, the greater the rest, but the longer it takes to wake up and respond when there is work to do.
In everyday computing C-states behaviour is beneficial and usually unnoticeable, helping extend battery life on laptops and reducing power usage on desktops and servers. A delay of a few or even tens of microseconds when resuming a thread is irrelevant for typical workloads such as web browsing or using spreadsheets. For an HFT engine however, losing tens of microseconds when responding to market data can be the difference between a profitable and a loss making strategy.
C-State commands
We next examine the current C-state configuration of the server used to run Apex and show the commands used to inspect it.
As a reminder, our CPU model is Intel(R) Core(TM) i7-6700 CPU @ 3.40GHz (which can be found by running the command cat /proc/cpuinfo | grep name).
We can list the available C-states via the /sys subsystem
for s in /sys/devices/system/cpu/cpu0/cpuidle/state*; do
    echo “$(basename “$s”):” $(cat $s/name)
done
For the production server used for this study, this gives:
state0: POLL
state1: C1
state2: C1E
state3: C3
state4: C6
state5: C7s
state6: C8
For each of these C-states, we can also examine their exit latency (in microseconds):
paste  \
    <(for s in /sys/devices/system/cpu/cpu0/cpuidle/state*; do cat $s/name; done) \
    <(for s in /sys/devices/system/cpu/cpu0/cpuidle/state*; do cat $s/latency; done)
POLL 0
C1 2
C1E 10
C3 70
C6 85
C7s 124
C8 200These numbers show that all C-states other than possibly C1 are unsuitable for HFT. Even for general trading systems, anything deeper than C1 begins to introduce noticeable wake latency.
Note that the POLL state is not a sleep state. It indicates that the CPU is in C0 - fully electrically awake - and the kernel idle thread is busy-spinning instead of sleeping, remaining fully active while waiting for work.
C-state usage depends on system activity. A CPU with sustained workload is unlikely to enter deeper states, while an idle CPU will tend to move into them quickly. To monitor which states are actually being used over time, we can use the turbostat tool, which tells us residency percentages for each C-state.
sudo turbostat --quiet \
    --header_iterations 10 --interval 2
    -show “CPU,Busy%,POLL%,C1%,C1E%,C3%,C6%,C7s%,C8%,CoreTmp”
When the trading engine is not running, the output from this command is like below:
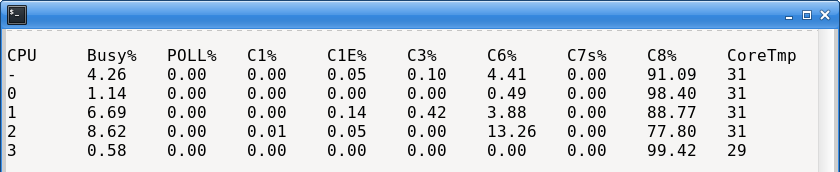
This shows that the deepest C-state (C8) is occupied almost constantly, for all four cores. The CPU spends the vast majority of its time in its deepest sleep state.
If we now start the engine and measure again, we get a slightly different output:
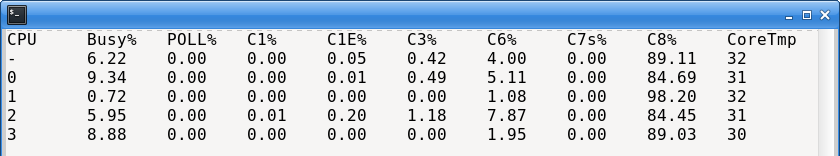
We can see that the CPU is still sleeping most of the time, but the proportion of time spent executing application instructions (the Busy% column) has increased a little, as would be expected. The temperature has also slightly increased.
It may seem surprising that the CPU remains mostly in deep sleep even while the engine is running. The reason is that trading engines can spend most of their time waiting for socket data, and in this example only four instruments are subscribed to. Market data is just not arriving at a high enough rate to keep the CPU busy.
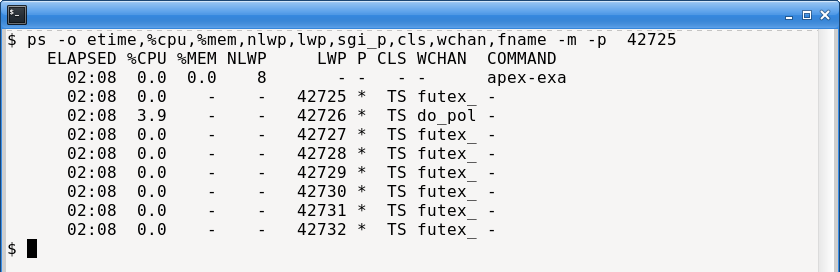
To illustrate this point further, here is the ps output of the engine. It has 8 threads, only one of which is responsible for handling market data (the IO thread), and it is not very active, in terms of %CPU:
This actually suggests a broader deployment pattern. We can increase the number of names handled by a single engine instance until the market-data processing requirements exceed what the hardware and software can sustain. This becomes particularly important for equity strategies, where it is infeasible for one engine to process hundreds of symbols. Instead, a practical architecture is to run multiple engine instances, each configured to trade a different subset of names.
Given the observed behaviour and our understanding of C-states, we can form a testable hypothesis: C-states are the primary contributor to the measured latency, and disabling them should yield improvements on the order of microseconds.
P-States
While examining C-states, it is also useful to briefly mention P-states.
P-states are a separate CPU power-management mechanism. Whereas C-states reduce power consumption by disabling internal CPU components during idle periods, P-states save energy by lowering the processor’s clock frequency, and voltage. As a result, a CPU with a rated frequency of 3.4 GHz may operate at substantially lower frequencies - such as 800 MHz - under light load.
The server we are using to run our trading engine has had its CPU fixed to maximum CPU. This can be achieved at runtime by issuing this command:
sudo cpupower frequency-set -g performanceTo monitor ongoing CPU frequency - to ensure the command has worked - we can ‘watch’ the output of lscp :
watch -n1 "lscpu --online --extended"Disabling C-states
Next we walk through how to disable C-states. There are several ways to do this, including kernel boot parameters and runtime configuration. Here we focus on the runtime approach.
To disable C-states, we can use the cpupower utility, telling it to disable all states with an exit latency greater than 1 microsecond. In practice, this disables all CPU sleep states:
sudo cpupower idle-set -D 1We can confirm this has worked by listing which states are disabled, and checking the list includes all the sleep states:
$ sudo cpupower idle-info  | grep -i disable
C1 (DISABLED) :
C1E (DISABLED) :
C3 (DISABLED) :
C6 (DISABLED) :
C7s (DISABLED) :
C8 (DISABLED) :
We can run turbostat again to view the ongoing behaviour of the CPU. As shown below, the CPU is now busy almost all the time, and not sleeping at all. However it has no real workload - instead it is simply checking for work instead of sleeping.
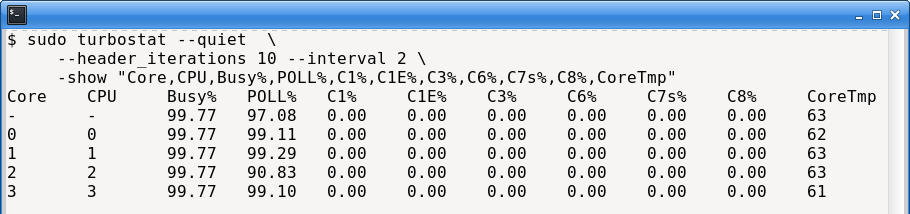
We also observe a large increase in temperature. This is expected: disabling all C-states forces the CPU to remain fully powered, which is one reason high-end HFT systems sometimes require advanced cooling solutions.
Results
With the server configured for C-states disabled and the P-state locked to its maximum frequency, we can rerun the engine latency tests to see what effect it has.
The tests are conducted as before: the engine runs for several hours, subscribing to four Binance Futures instruments: BTCUSDT, ETHUSDT, SOLUSDT, and ADAUSDT.
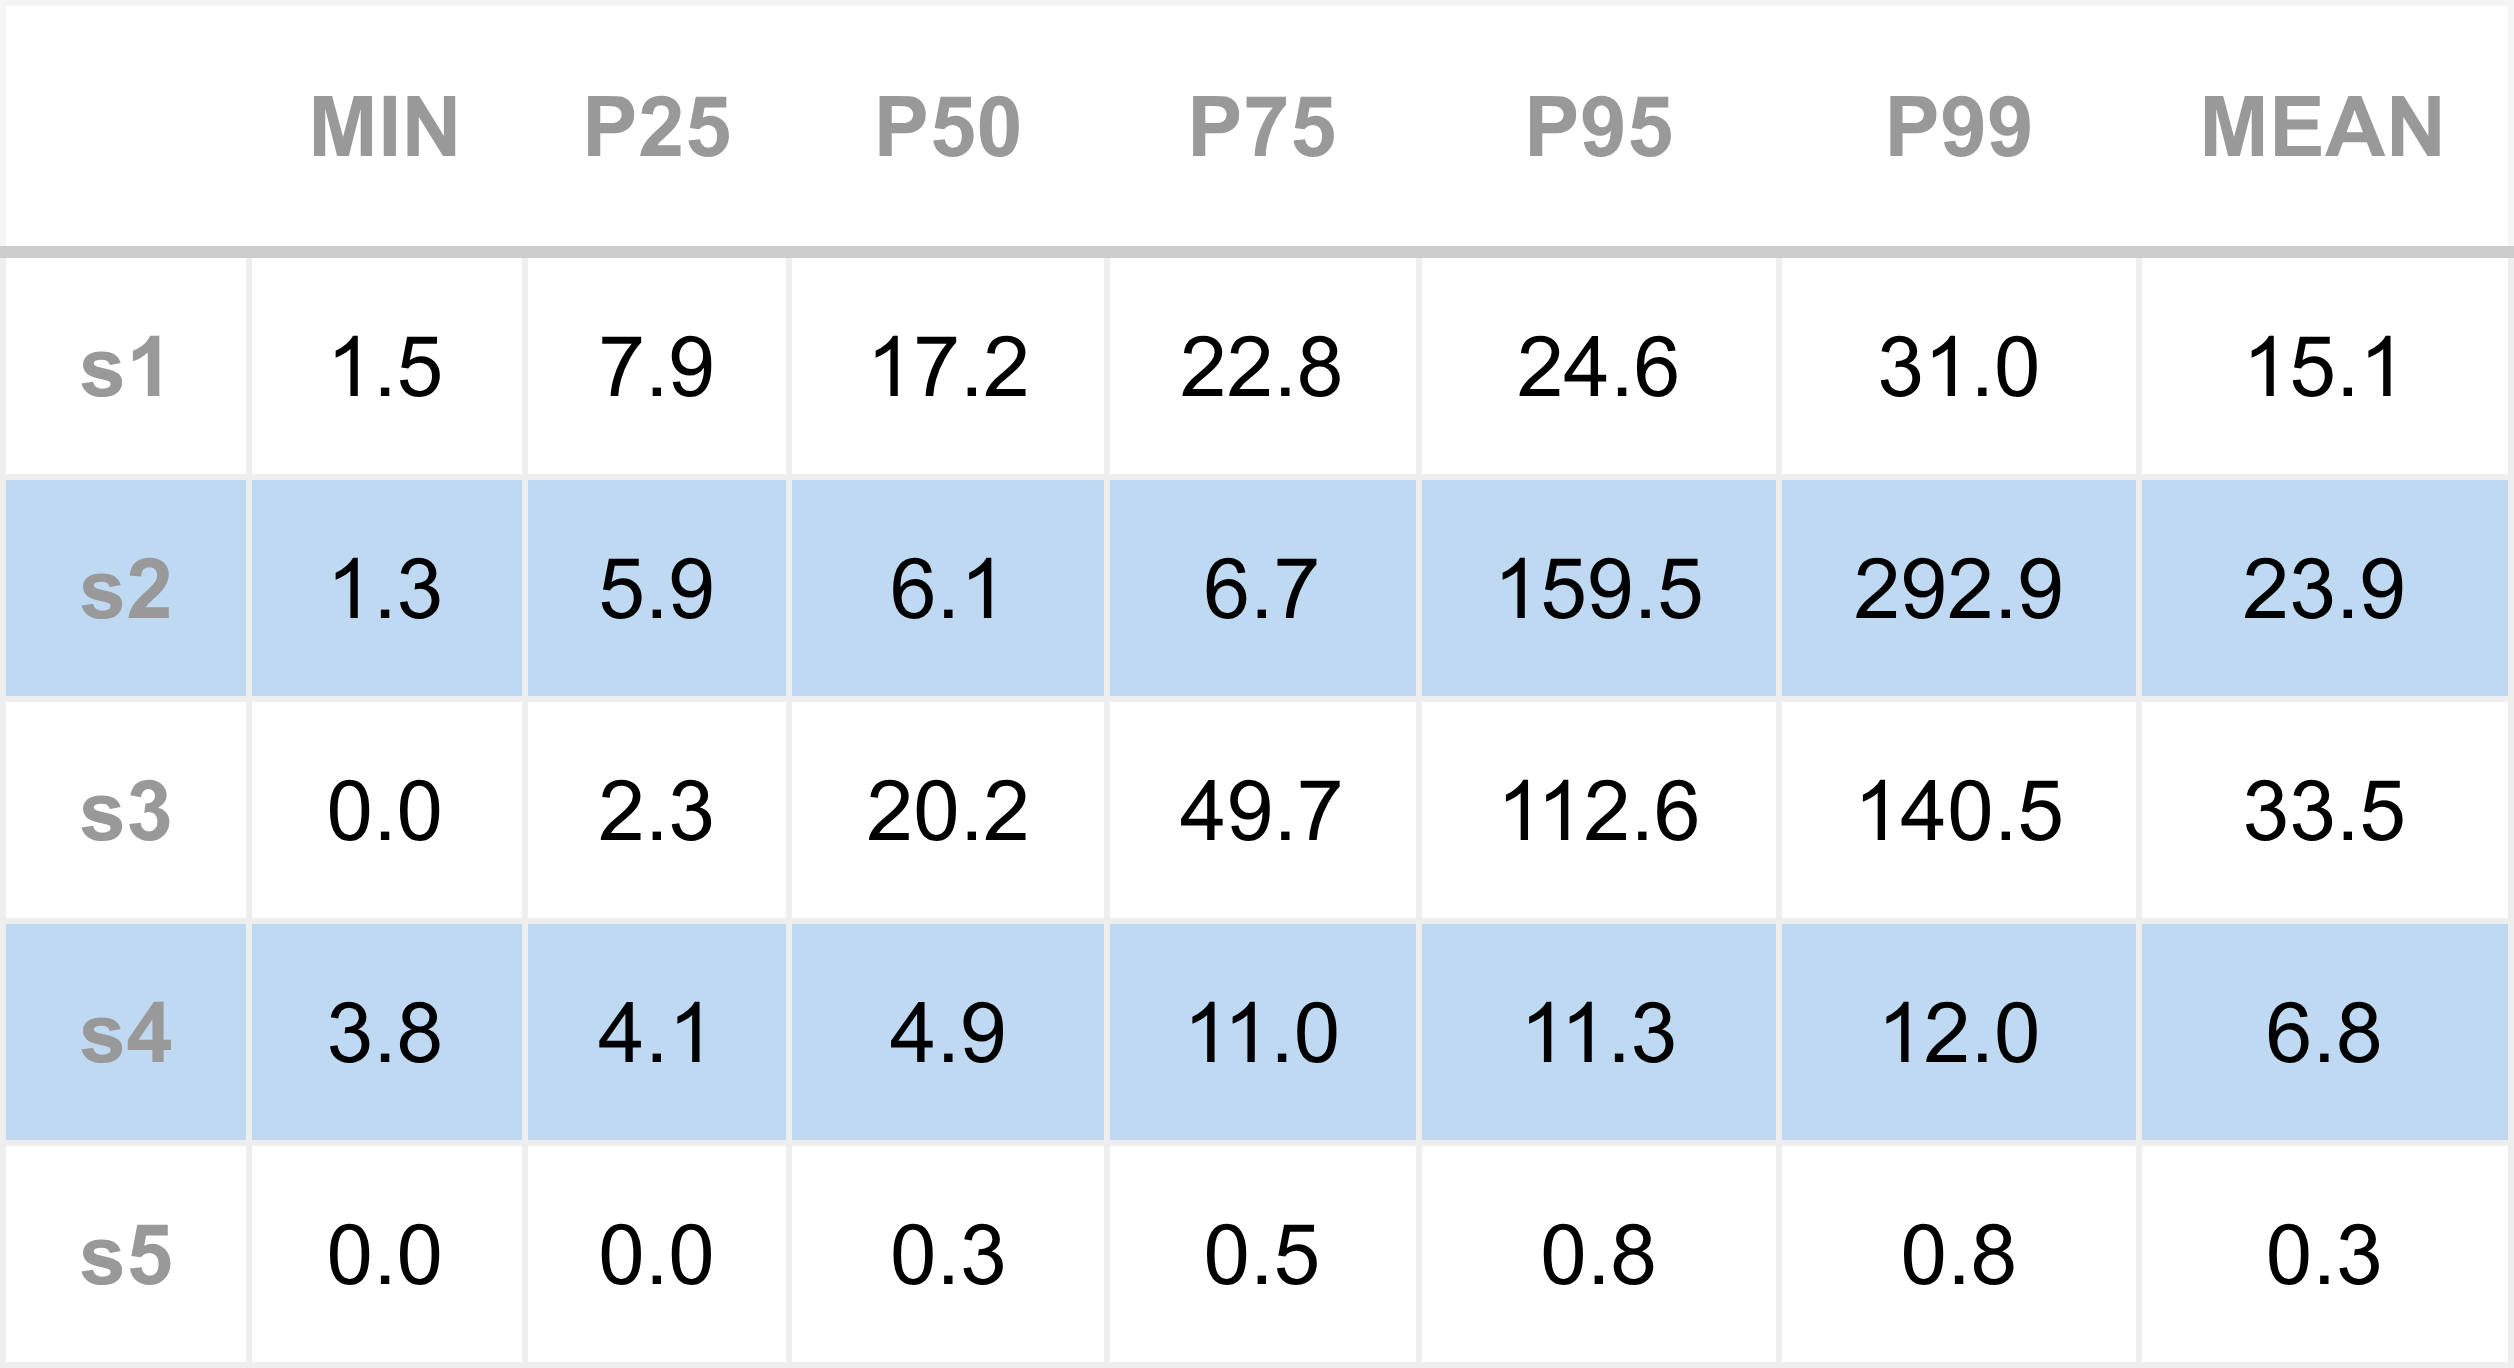
First, we reproduce the baseline performance, running the engine before C-states were disabled. As previously observed, the median (P50) total inbound socket-to-model latency is roughly 50 µs. As a recap, the processing steps are, S1: socket-read; S2: TLS/SSL; S3: web-socket; S4: JSON message parsing; S5: model update (see previous article here).
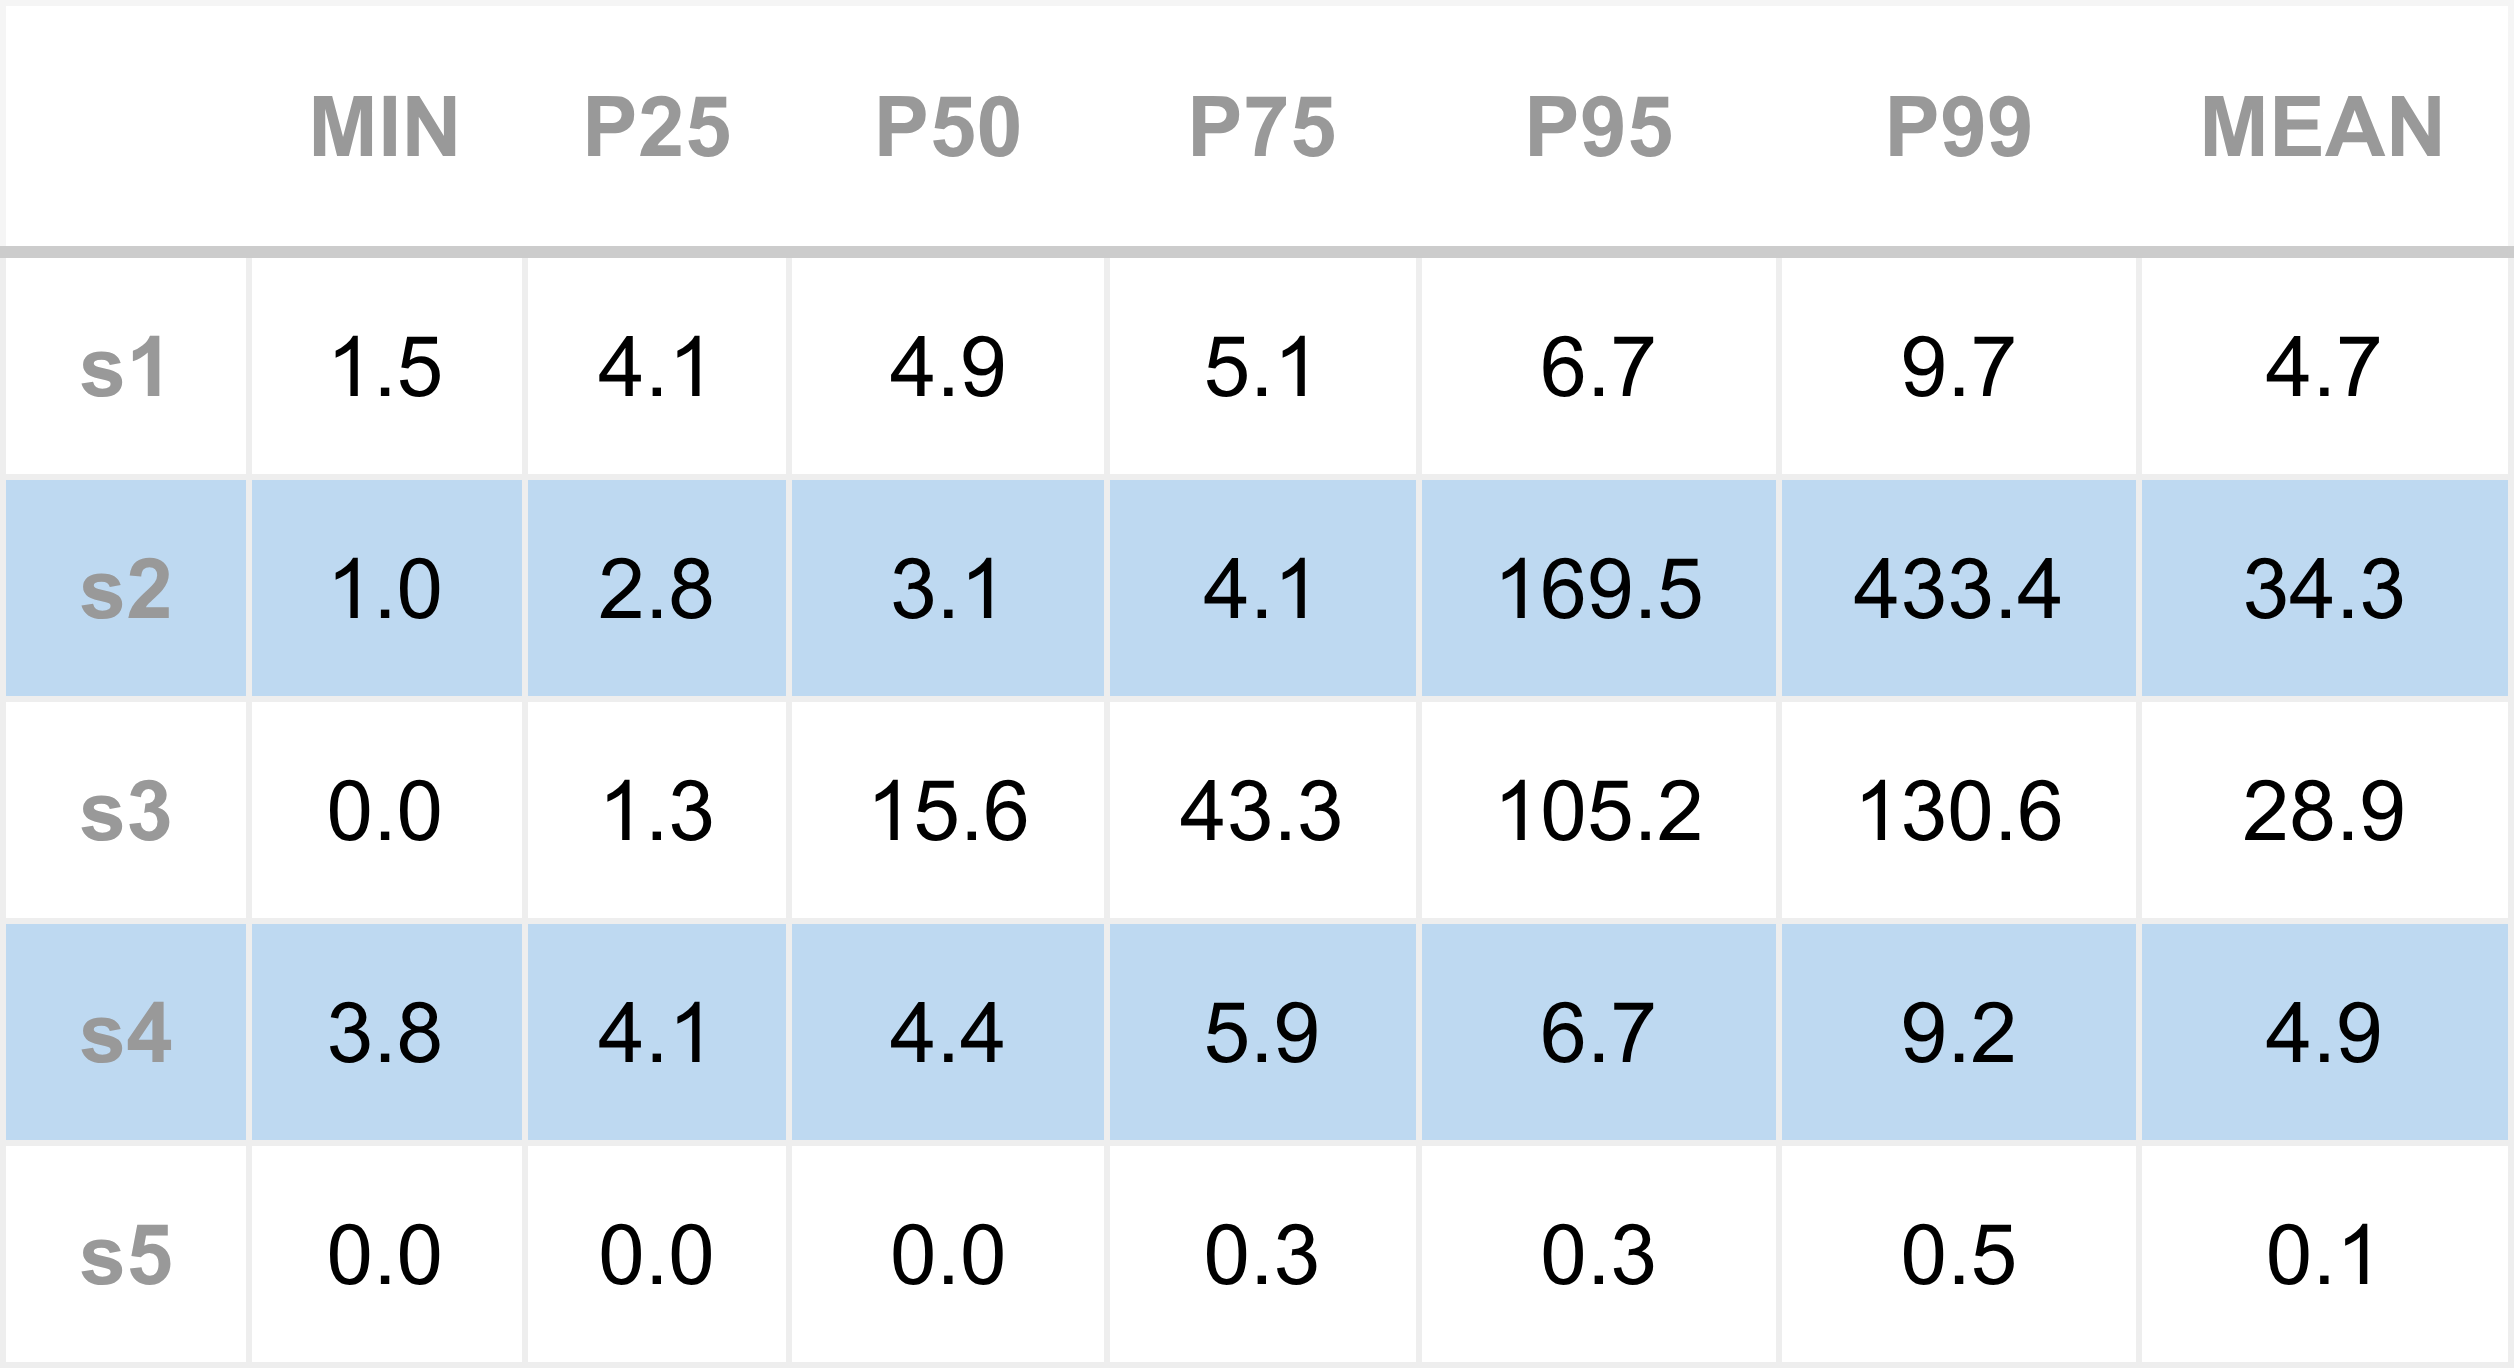
After disabling the C-states, we rerun the engine and collect the following results:
We can see clear performance improvements across nearly all series. Figure 1 shows the comparison of the the median (P50 latency).
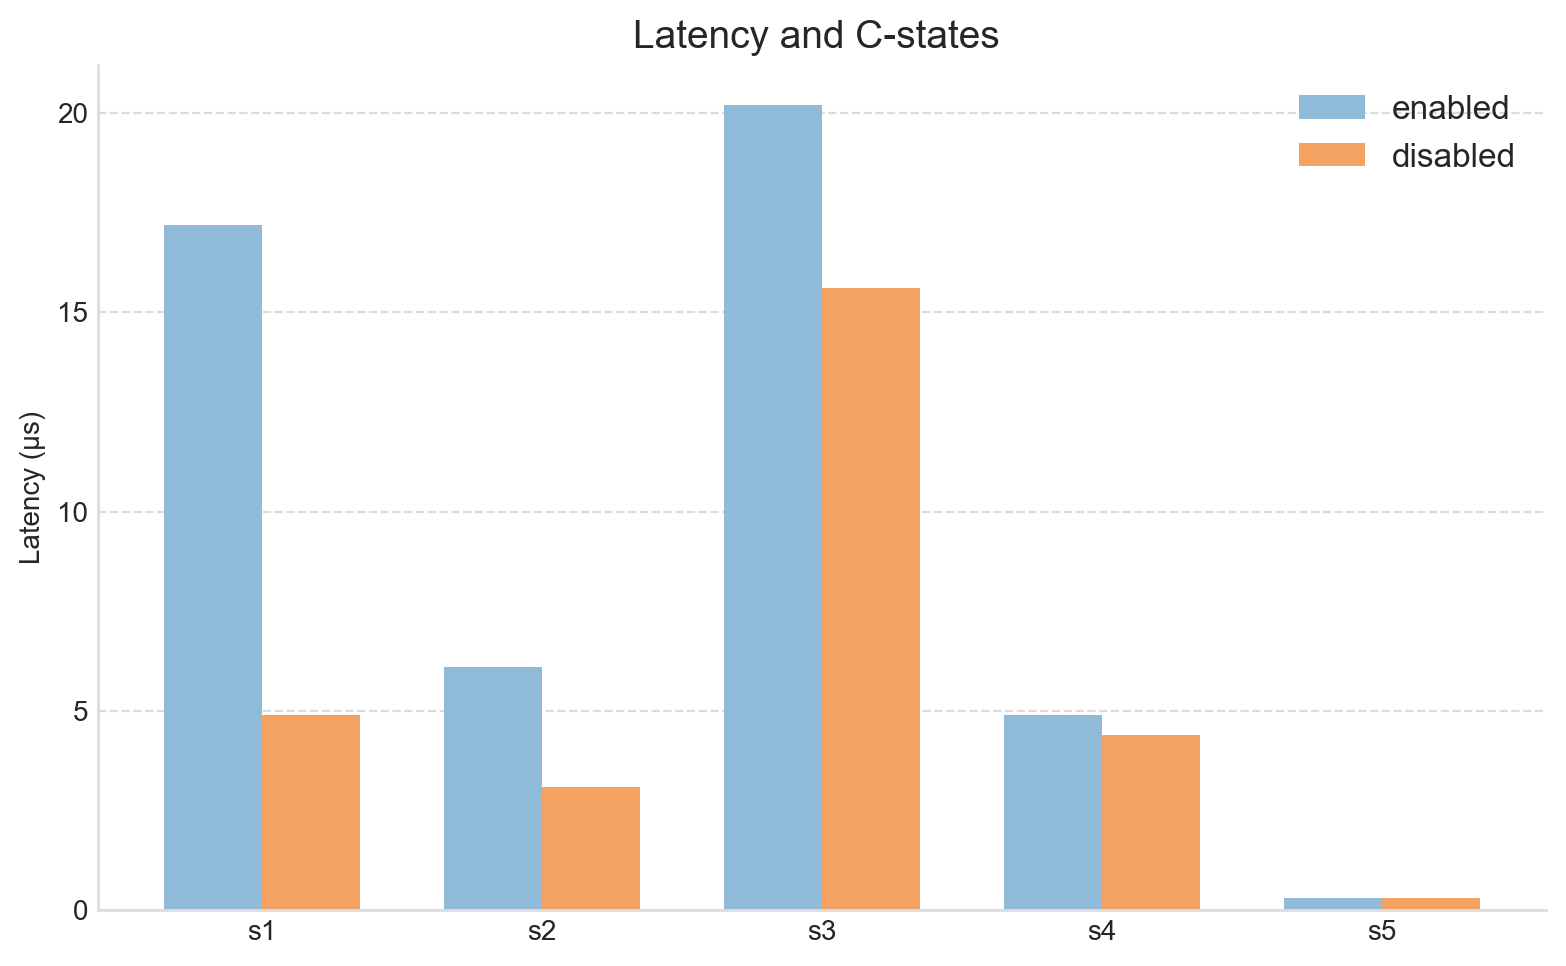
Focusing on the P50 values in particular, the S1 (Socket poll → read) latency has improved significantly, from about 17 µs down to 4.9 µs. The total latency has dropped to around 27 µs, almost half of the baseline (recall, this is the region of code that appeared to do very little, but took up-to 17 microseconds).
It’s also worth noting that the minimum latency has barely changed. This is expected: minimum latency typically reflects the optimal case where CPU, cache, and memory states all align perfectly to process the next market data tick. Further reductions there would likely require code-level optimisations rather than system-level tuning.
Our starting idea was that C-states were the cost of the unexpected latency, and these results strongly support that.
Summary
In this article we set out to improve the latency of the Apex trading engine by asking a data-driven question: why was the engine taking so long to do apparently very little? Specifically, we focused on the gap between receiving a notification that data was available on the socket and actually reading that data.
We examined one well-known source of system latency - CPU C-states - which can have disastrous consequences for trading engines. We showed how to inspect these states on a Linux server and how to disable them.
After disabling C-states, our headline latency metric - the median total time spent on the inbound pathway - improved dramatically, dropping from a baseline 50 µs to around 27 µs, an almost 50% gain.
For low-latency trading, both hardware and software must be tuned to a high degree. So far, we’ve covered two key hardware-level settings, P-states and C-states, that can cause serious performance degradation if left enabled. In production-grade HFT environments, these are often disabled directly in the BIOS or via kernel boot parameters to ensure consistent performance.
The current results are solid for a general trading engine, but still short of what’s required for true low-latency operation. There’s more work to do, and that’s where we’ll continue next.