HFT Engine Latency - Part 3
What happened to my memory?

Introduction
In earlier articles we examined the latency of the Apex trading engine and explored system-level tuning, including optimising C-states and P-states. This post continues the latency journey, turning our attention from the hardware & operating system to the software itself.
We continue a data-driven approach, using existing results to guide the investigation and collecting additional metrics to further narrow our focus. This ensures our efforts are informed by real-world evidence rather than guesswork.
Along the way, we’ll show how to use advanced Linux tools and coding techniques to dig into production systems and get a glimpse of what the engine is doing “under the hood.” By following this process, we can uncover latency bottlenecks and identify the next areas for improvement.
Current Performance
We continue our latency investigation by reviewing the current performance numbers. We wish to know which part of the code is taking the longest, and choose that for further analysis. The principle is simple: concentrate on the section currently performing the worst, because improving that will yield the greatest payoff for the time and effort spent.
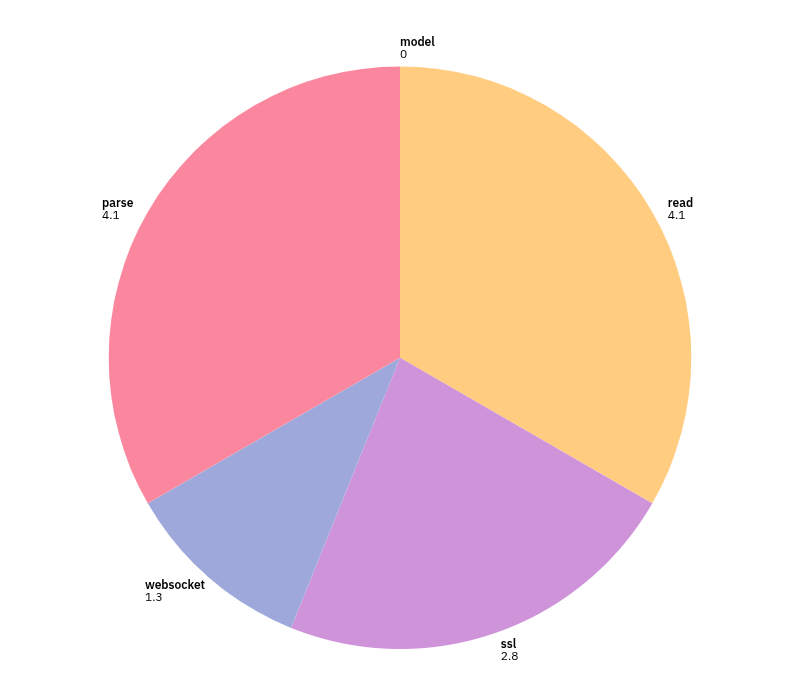
The current latency numbers, in the table below, show that stages S3 (WebSocket) and S4 (parsing) are among the worst performers. Although S1 and S4 appear equally poor at each percentile, S4 stands out for its minimum latency of 3.8 microseconds. The later pie chart, presenting data for the 25th percentile, shows how much time is taken up just by parsing.
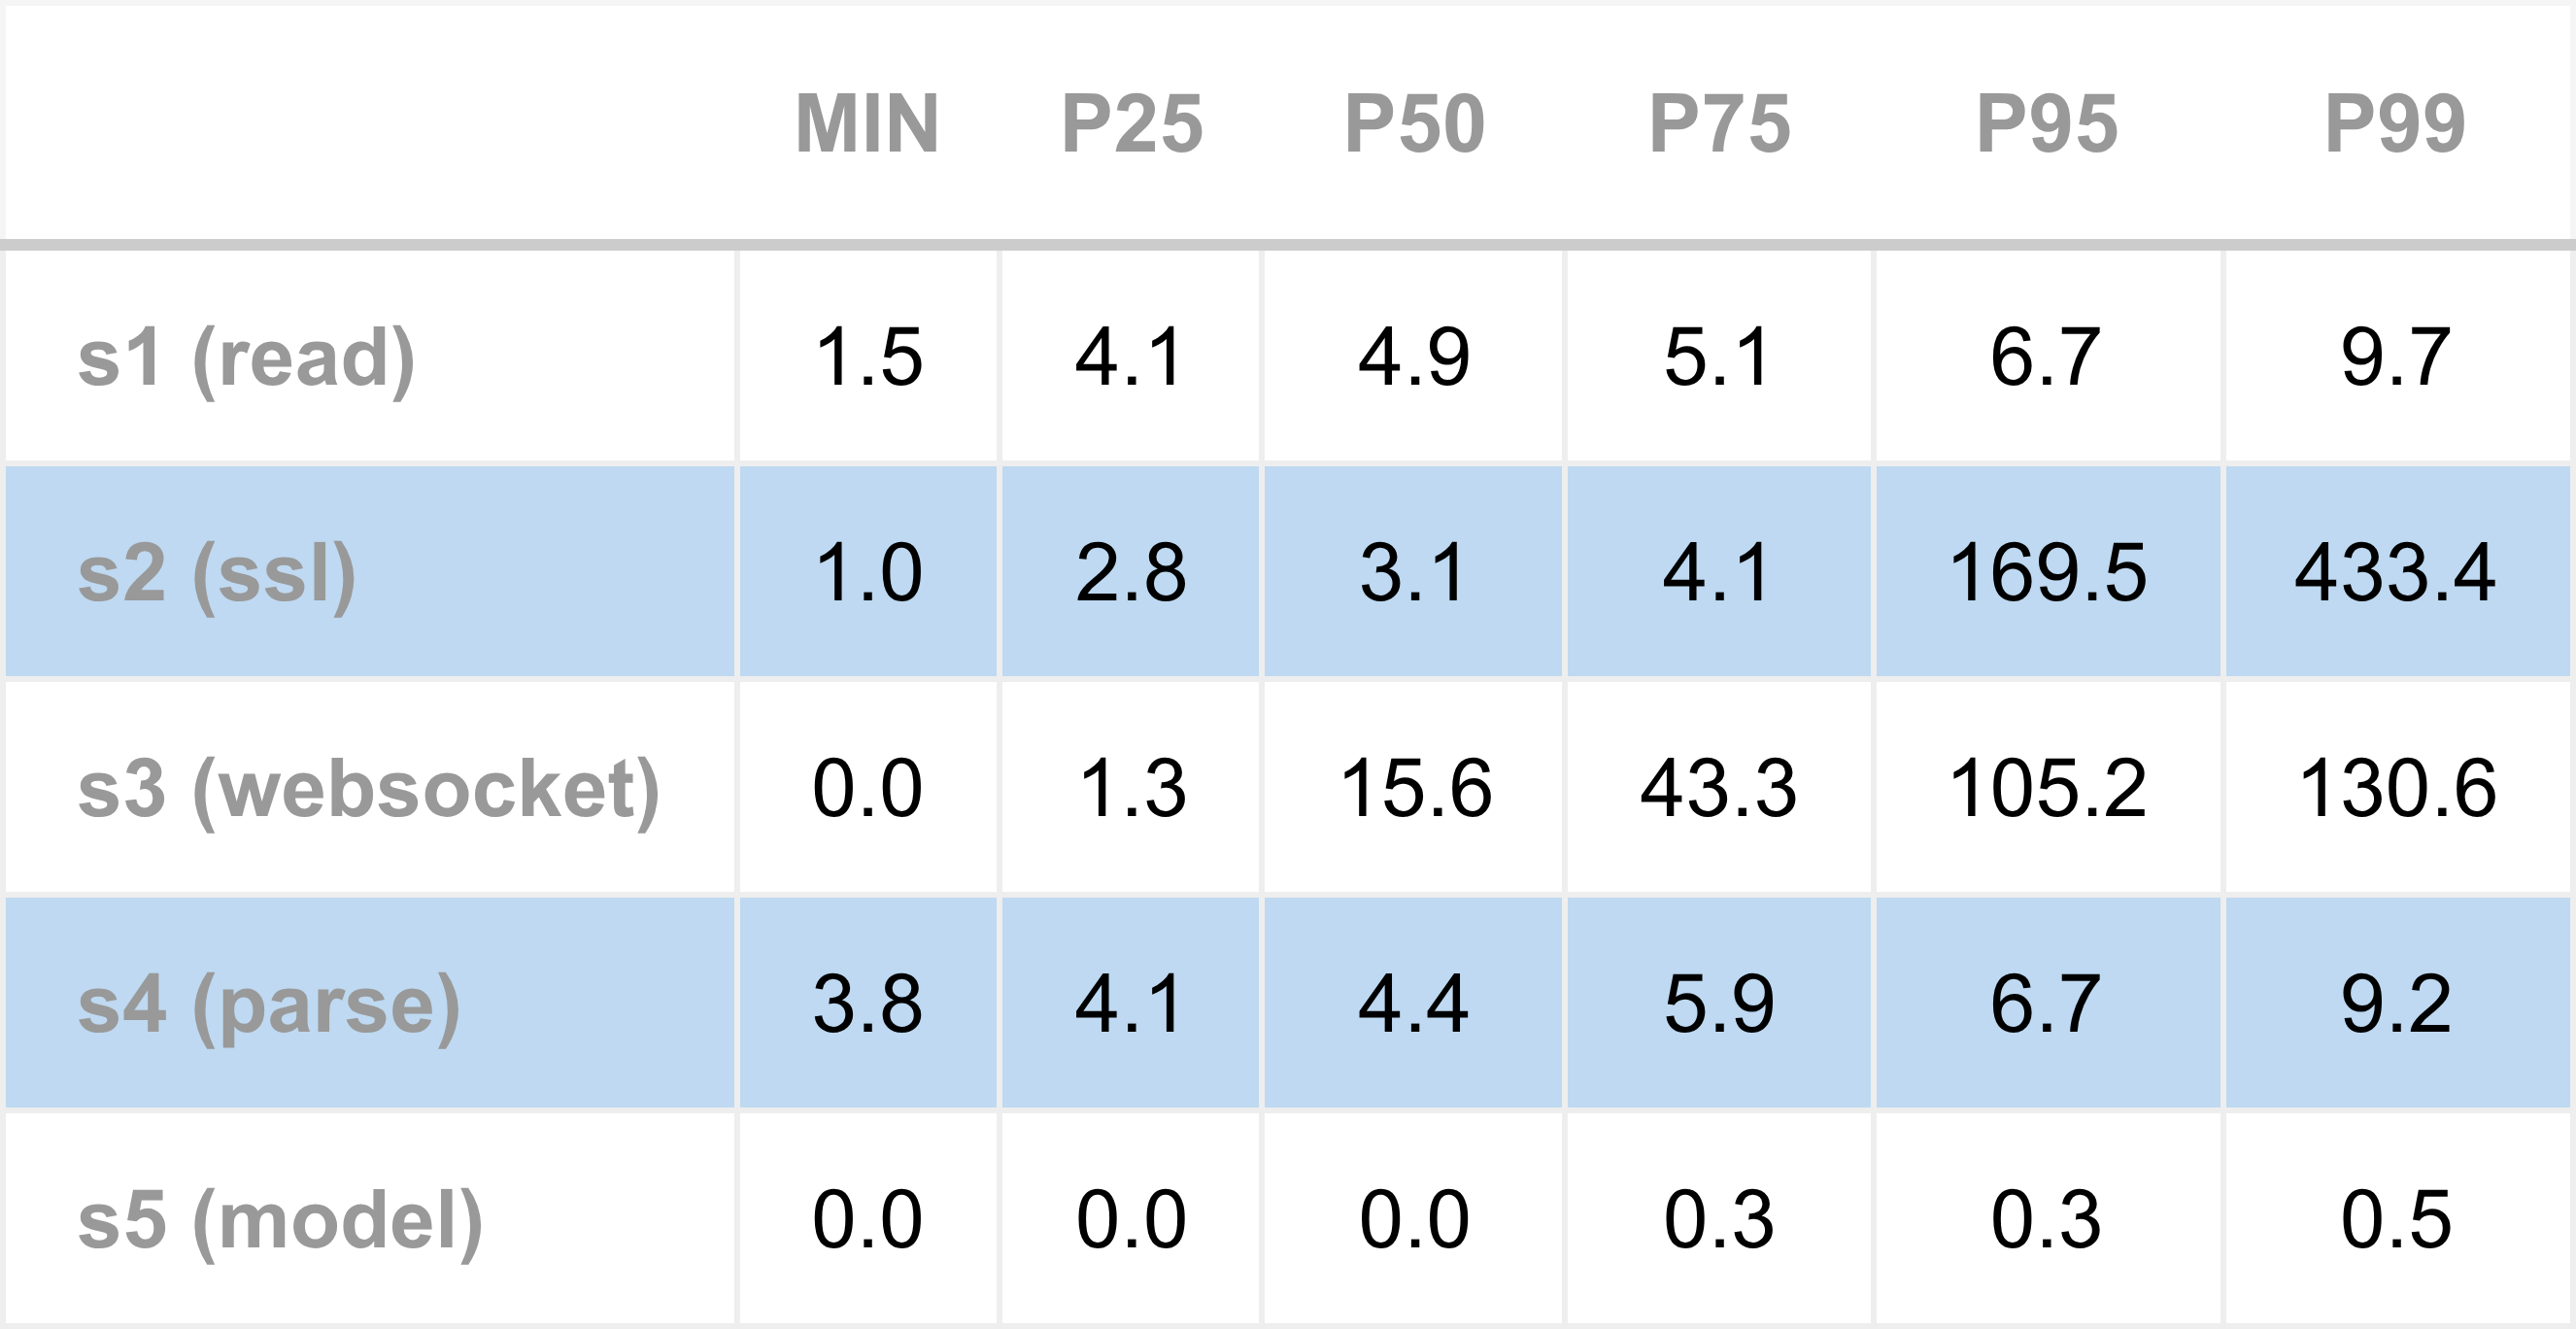
Overall, S3 might appear to be the worst performer, but a caveat is needed. S3 measurements likely suffer from queuing effects, meaning the recorded time includes not only processing a WebSocket message but also waiting for earlier messages to be fully processed. Removing queuing effects on latency numbers is something we will return to later.
S3 and S4 are the core market data parsing steps. S3 measures the cost of separating a stream of TCP bytes into a sequence of complete WebSocket messages, while S4 measures the cost of parsing a single WebSocket message into a stack local JSON object. Neither task is inherently complex or time-consuming. Both involve the CPU scanning through small sections of linear memory, looking for simple patterns of bytes that delineate message and field boundaries. On a modern processor capable of several billion instructions per second, these operations should not take more than 1 microsecond. Yet, JSON parsing in S4 never runs faster than 3.8 microseconds, which clearly indicates something is wrong here.
What could be wrong? Whenever unexpected latency occurs - whether a poor baseline or high jitter - there are a number of common culprits, including contention on shared resources (such as mutexes), thread wake-ups, intensive CPU operations, system calls, resource creation & destruction (such as memory), or slow I/O (such as disk writes). Since S3 and S4 both involve processing byte buffers, string operations, and creating JSON objects, the most likely suspect is memory management.
Could the unexpectedly high message parsing latency be related to memory management? This leads to a concrete question: how is memory used by the engine while it processes market data? Answering it requires looking under the hood to understand what the application is doing beyond the explicitly written C++ code.
Memory Profiling
Linux systems are fortunate in offering a variety of powerful, free tools for examining application memory usage.
For this investigation, we use heaptrack, which is easy to run and provides a clear, graphical interface for interpreting profiling data. It is fully non-intrusive: the trading engine does not need to be modified or recompiled; we simply start heaptrack with the engine passed as an argument.
Ease of use matters when profiling systems. Tools that are quick to launch and provide immediate feedback encourage experimentation, making it practical to investigate performance questions as they arise. Note that profiling tools such as heaptrack should generally not run in production, because they hugely slow down runtime performance.
To use heaptrack just provide it as a prefix when starting the engine:
heaptrack apex-example-latency --config apex-example-latency.jsonThe engine is run in this configuration for a few minutes - long enough to process several thousand market data messages. It is then killed, which causes heaptrack to write a “.zst” file containing the raw profiling data. To examine the results, we open this file using heaptrack_gui:
heaptrack_gui heaptrack.apex-example-latency.7427.zstThe first graph of interest is total allocations over time. This shows how many memory allocation requests the engine makes over the course of its operation. Note that we are not looking for memory leaks here - a common use case for these tools. Instead, we want to determine whether, and how often, the process is requesting new memory during normal operation.
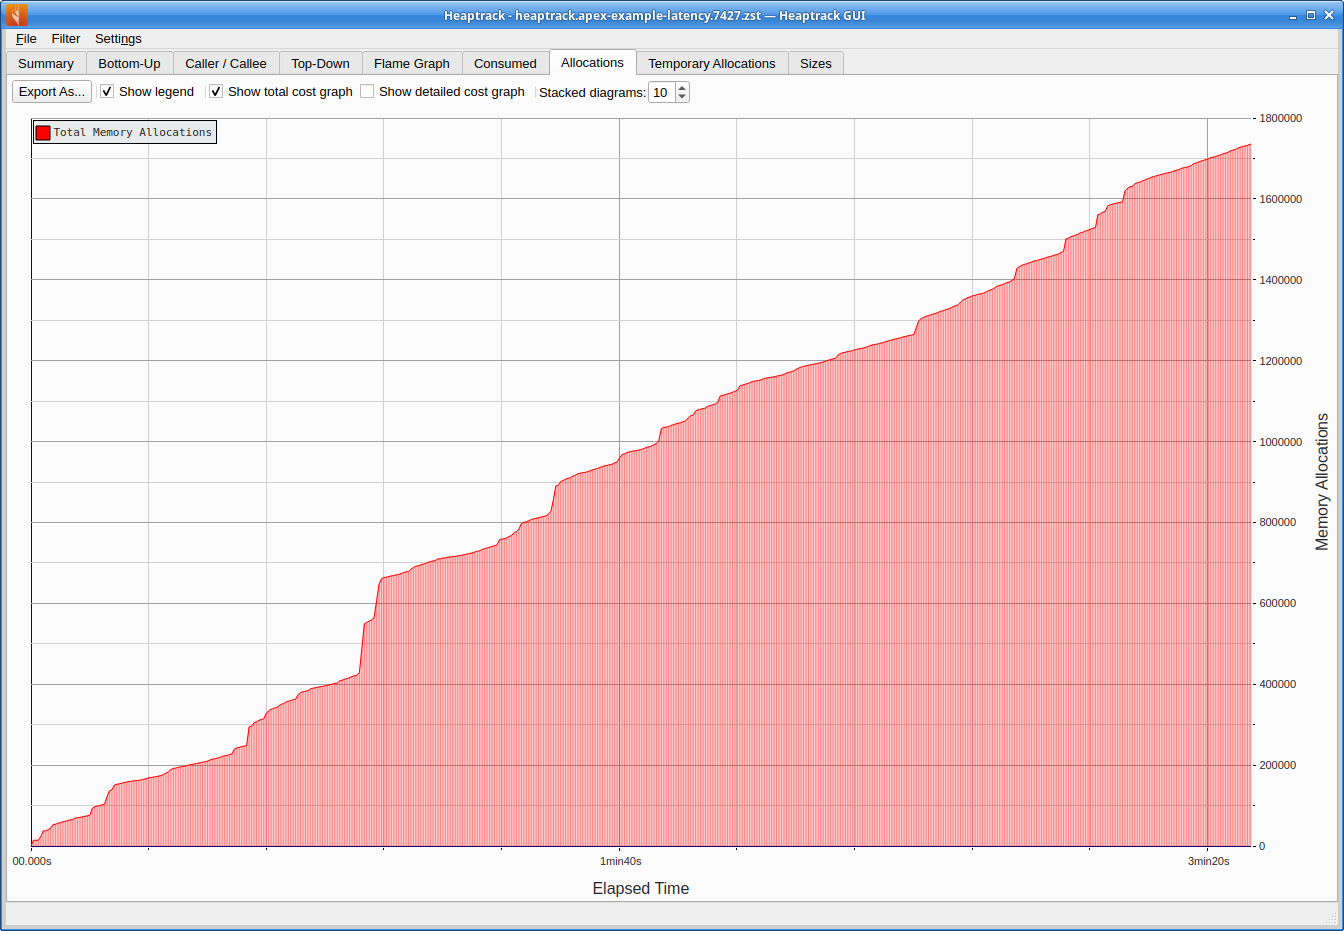
The graph shows that the total number of allocations rises steadily over the engine’s lifetime, indicating that allocations are occurring continuously. Over the approximate three minute run, the engine makes roughly 1.7 million allocations - around 8,000 per second. This is a very poor result for a low-latency system. Each allocation consumes CPU time and adds latency. In an ideal low-latency setup, we would aim for zero heap allocations along the critical path, as the engine processes market data, evaluates signals, and manages orders.
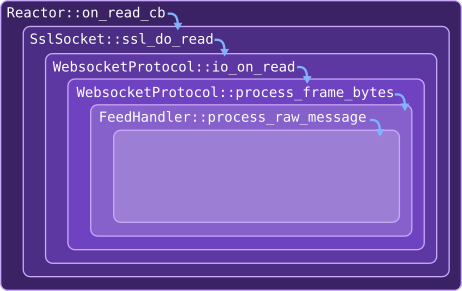
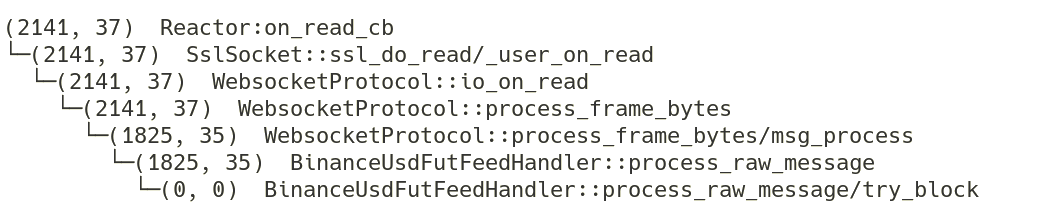
What is causing these allocations? Well heaptrack can help answer this too. Using its top-down view, sorted by allocation count, we can inspect the call stack responsible for the highest number of allocations. This is shown below.
Towards the top-left outermost level, we see the I/O reactor main event loop. Moving down the stack toward the innermost calls - those closest to the actual allocation sites - we arrive at the feed handler method process_raw_message. Within this scope (highlighted), the allocations appear to originate from the JSON library.
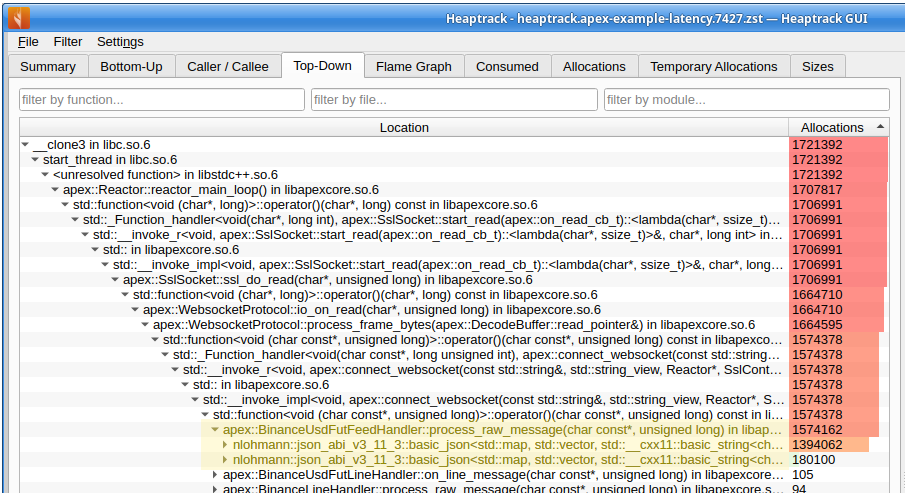
This indicates that the memory allocations are driven primarily by the JSON library used to parse market data, as invoked from within the Binance feed handling code.
Custom Instrumentation
In addition to external tools, we can build a small, custom profiling tool to obtain finer grained data. This approach allows us to pinpoint exactly which lines of code are responsible for memory allocations and to count how many occur.
For HFT developers, the ability to write small custom tools is invaluable when undertaking investigations. Lightweight instrumentation added directly to the system often provides the quickest and most effective way to investigate what is happening “under the hood.” Such purpose built “quick and dirty” utilities can reveal insights that general purpose tools might miss.
A simple technique for tracking memory usage is to replace the default C++ memory management functions with custom implementations. These replacements perform the usual allocation and free operations, but also increment a counter to record the total number of requests made.
The following code illustrates the basic idea. When included in the build, it replaces the default C++ operator new (note that additional overloads of new are also needed to fully capture all allocations):
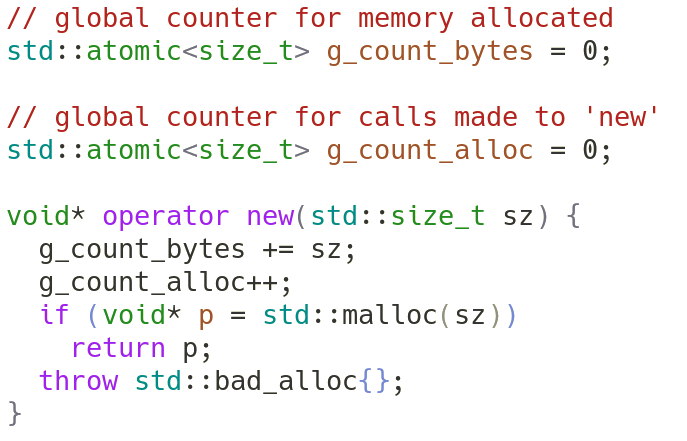
This simple override allows us to track both the number of allocations and the total memory requested by the application. Each call to new increments the counters before forwarding the request to malloc, while delete continues to free memory as usual.
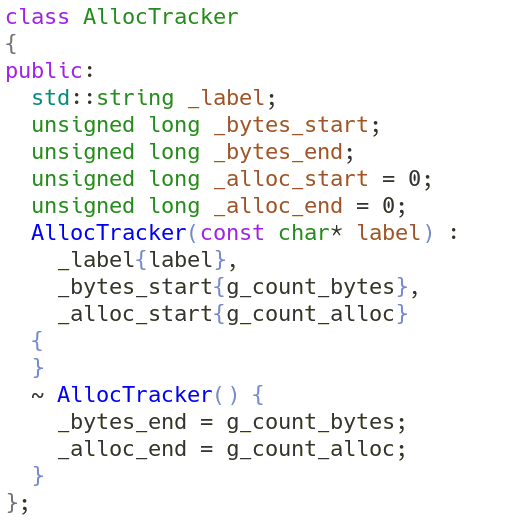
With the global variable g_count_alloc tracking the total number of allocations, we next need a way to capture its value before and after a section of code we wish to profile.
The RAII pattern is well suited for this purpose. We can create a class that records the allocation counter during construction (the “before”) and again during destruction (the “after”). This allows us to measure memory allocations across a specific scope automatically. Here is an initial version of the code to illustrate the concept:
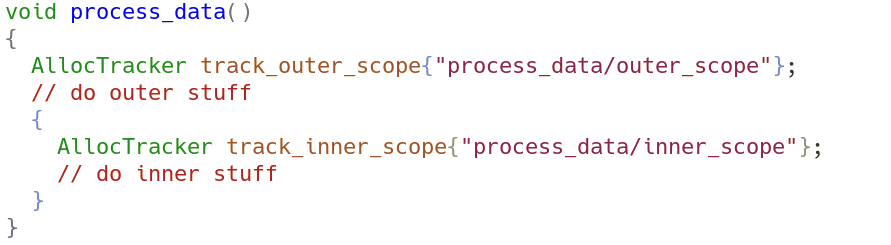
Using RAII makes it natural to nest capture sections, allowing for hierarchically scoped measurements. In the following example, track_outer_scope tracks memory allocations for the entire function, while track_inner_scope tracks allocations occurring only within the inner block.
Results
Based on these ideas, an allocation tracker utility class (AllocTracker) is added to the engine. The earlier concept is extended slightly: captured values are stored in a global array, which is then printed in reverse order. This ensures that outer scopes are displayed above and before inner scopes, with indentation used to indicate the scope hierarchy and depth.
The tracker must be explicitly enabled at compile time, as it is disabled by default. This is a deliberate design decision intended to minimise the risk of accidentally enabling the instrumentation in production, where it could silently degrade latency. In any trading system, continually minimising such accidental operational risks is a constant concern.
Allocation measurements are inserted at each level of the market data processing call chain. The outermost scope corresponds to the I/O function that reads bytes from the socket. Successive scopes - covering SSL decoding, WebSocket decoding, and finally JSON message parsing - also have trackers added. This structure allows the outermost tracker to measure allocations across the entire call chain, while inner trackers help pinpoint where those allocations originate.
With the instrumentation compiled in, the engine is run for around one minute, and then killed once a representative sample of tracking logs are printed on the console. At this stage we are not collecting aggregate statistics; the goal is simply to explore where memory allocations occur during inbound market data processing.
Clear diagnostic patterns quickly emerge. The most common pattern, shown next, corresponds to the logging associated with the receipt and processing of a single market data message as it travels down the call chain.
Each line corresponds to the values captured by a separate scoped AllocTracker instance. The first number is the total bytes allocated, while the second is the number of allocation calls made (the value we most care about), for the scope of that tracker instance.
The outermost scope, encompassing the entire call chain starting from socket I/O, reports 37 allocations. This tells us that 37 allocations are made over the entire call chain, when processing a single market data single message.
The nested data allow us localise where these allocations occur. We can infer that 2 allocations must occur somewhere within WebsocketProtocol::process_frame_bytes, because across that method there were 37 allocations made, but 35 are accounted for in its immediate child scope msg_process.
The highest concentration of allocations - 35 in total - occurs inside the method BinanceUsdFutFeedHandler::process_raw_message. All of these occur before the process_raw_message/try_block child scope (which records zero allocations). The two lines of code between these scopes perform the task of parsing a memory buffer into a local JSON object:
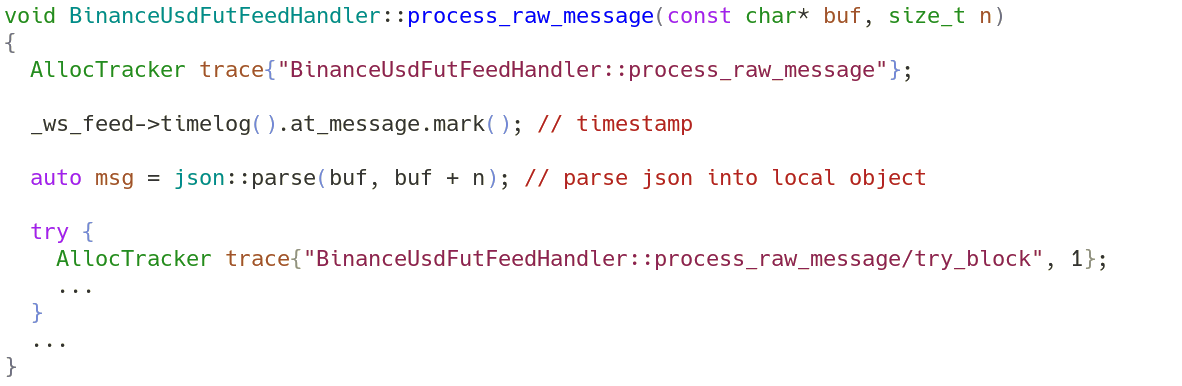
This confirms that JSON parsing and object construction are responsible for the majority of allocations, exactly what heaptrack earlier suggested (the line commented with “timestamp” line can be discounted, it just records the current time). Each raw market data message parsed into a local JSON object causes 35 allocation events. This is not particularly surprising: JSON processing inherently involves string handling, along with maps from keys (strings) to values (often more strings). Wherever strings are involved, memory allocations are difficult to avoid unless the implementation explicitly targets a zero-allocation approach.
The engine currently uses an external library, JSON for Modern C++, for JSON parsing. The conclusion, therefore, is that this library is not suitable for processing market data messages in a high frequency trading setting, because it performs heap allocations on every parse of incoming data.
Conclusion
This article continues the theme of reducing trading engine latency. Rather than tuning the server or operating system, we have started to focus on improving the code itself.
As in earlier investigations, we adopted a data-driven approach, by focusing on areas with high or unexpected latency, and then drilling down into the underlying causes. One particularly poor performance was message processing latency, which was never faster than 3.8 microseconds.
A key part of latency analysis and optimisation is gathering more detailed data about the system. Based on where the latency was observed to be worst - during message parsing and likely string operations - we collected additional data on how the engine manages memory.
To dig into memory behaviour we used a combination of an external profiling tool and custom instrumentation. Being able to build small, effective profiling tools to ask targeted questions of a system, and to look under the hood, is an essential skill for HFT developers.
The results point clearly to the JSON parser as a source of latency. The Apex engine currently uses JSON for Modern C++, and this library appears to perform multiple heap allocations for every market data message processed. Each allocation consumes CPU time and degrades low latency performance, yet these allocations are not actually necessary to extract simple values such as symbol, price, and size from raw data.
A guiding principle in HFT system design is to eliminate the unnecessary. While the critical pathway is performing avoidable tasks, it is not truly optimal. This investigation shows that the current parsing approach performs unnecessary memory allocations and points to the obvious next step: replacing the current JSON parser with an approach that avoids heap allocation entirely.